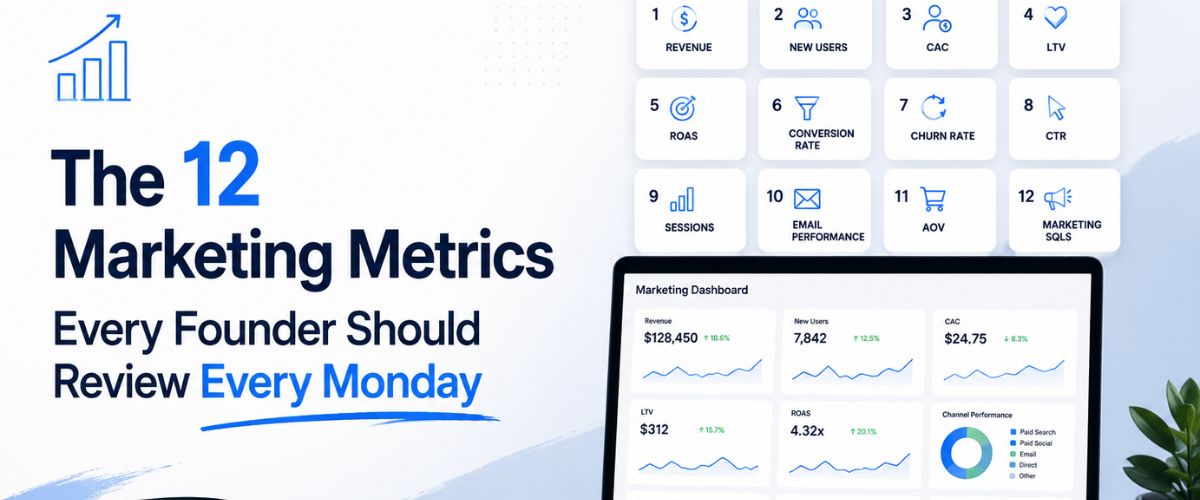
The 12 Marketing Metrics Every Founder Should Review Every Monday
Most founders glance at dashboards on Fridays, feeling good or bad depending on the numbers they spot. By Monday, they’ve forgotten what they saw. That’s not a data problem — it’s a review habit problem.
The founders I’ve worked with who grow fastest have one thing in common: a short, fixed Monday ritual. Not a two-hour analytics deep-dive. Usually 20–30 minutes, same metrics, same order, every week. It creates a feedback loop tight enough to actually change decisions.
Here are the 12 performance marketing metrics I recommend every founder look at before the week starts – and why each one earns its place on that list.
Customer Acquisition Cost (CAC)
What did you pay last week to acquire a new customer, across every channel?
CAC tells you whether your marketing is getting more or less efficient over time. A rising CAC isn’t always bad — if the average order value is also rising, the math might still work. But an unchecked CAC will quietly eat your margins before you notice.
How to track it: Total marketing + sales spend ÷ new customers acquired in the same period.
Return on Ad Spend (ROAS)
For every rupee you put into paid media, how much came back?
3x ROAS means ₹3 in revenue per ₹1 spent. Sounds simple. But that number doesn’t tell you if you’re profitable; your margins do. The point of checking on Monday is catching campaigns that slipped below your break-even over the weekend, quietly burning budget with no one watching.
Where you need to land depends on your category. Most e-commerce businesses need somewhere in the 3–4x range to not lose money at scale. If your margins are thin, that floor is higher.
Marketing Qualified Leads (MQLs)
How many leads last week actually had any reason to talk to sales?
MQL numbers tell you if your top-of-funnel is working. When that count dropped out of nowhere, something broke upstream. Usually it’s one of three things: a landing page went down, an ad set got paused by accident, or a blog post that was quietly sending organic traffic slipped in rankings. None of those are obvious until you go looking.
Lead-to-Customer Conversion Rate
Of the leads sitting in your pipeline right now, how many actually bought something?
This is where the MQL number stops telling the truth. Founders hit their lead targets and still watch revenue flatline — and the gap usually lives here. When conversion rate drops, it’s almost always one of three things: the sales process has a hole in it, the ad promises something the product doesn’t quite deliver, or the price is stopping people right at the end.
Worth figuring out which one before you spend another rupee sending more people into the same funnel.
Website Traffic by Channel
Total sessions matter less than where those sessions came from.
Check organic vs. paid vs. direct vs. referral every Monday. If paid traffic drops and organic holds, that’s a budget allocation signal. If organic drops and nothing changed, check for a Google algorithm update or a technical SEO issue.
Bounce Rate and Time on Page
A hundred sessions from people who leave in four seconds tells you almost nothing useful — except that something isn’t working.
The number I pay more attention to is time on page for your highest-intent URLs: pricing, product, comparison pages. If that drops, something changes. Maybe the page loaded slower after a recent update. Maybe a new hero image pushed the CTA below the fold. Whatever it is, you want to catch it before you pour more ad spend in.
The bounce rate alone is noisy. Time on page, filtered to the pages that actually matter, is where the signal lives.
Email Open Rate and Click-Through Rate (CTR)
If you send emails — and you should — these two numbers tell you whether your subject lines and content still work.
Open rate decay is gradual. You often don’t notice it until you compare this week’s numbers against four weeks ago. Monday is a good time to make that comparison.
Cost Per Click (CPC) by Campaign
CPC shifts tell you what’s happening in your competitive landscape — even when you didn’t change anything.
A sudden CPC spike in a campaign you haven’t touched usually means a competitor increased their bids, seasonality changed auction dynamics, or your Quality Score dropped. Catching this on Monday means you can adjust before the week’s budget burns at a worse rate.
Social Media Reach and Engagement Rate
Vanity metrics? Only if you track them without context.
Reach tells you how many new people your content touched. Engagement rate (likes + comments + shares ÷ reach) tells you if those people cared. A post with 10,000 reach and 0.3% engagement is not performing the same as one with 2,000 reach and 4% engagement — even though the first looks better at a glance.
Revenue by Marketing Channel
Which channel actually drove revenue last week — not just traffic or clicks?
This is the metric most founders look at last, when it should be near the top. Attribution isn’t perfect, but even a rough view of revenue by channel tells you where to put more money and where to pull back. It also catches channels that look busy but aren’t converting.
Churn Rate (Weekly Trend)
Churn is quiet until it isn’t. If you’re in subscriptions or repeat purchases, one bad week left alone becomes a bad month, and by the time it shows up in a monthly report, you’re explaining it, not fixing it.
Monthly reviews are common. They’re also too slow. Weekly won’t always give you clean data. But two weeks moving in the wrong direction? That’s worth a conversation now, not a slide later.
Net Promoter Score (NPS) or Customer Satisfaction Score (CSAT)
This one belongs on your Monday list not because it changes dramatically week to week, but because reviewing it keeps customer experience inside your business rhythm.
Founders who only look at NPS quarterly tend to treat it as a report card. Founders who glance at it weekly treat it as a signal — and act on individual responses faster.
How to Actually Use These 12 Metrics
Reading numbers without a decision framework is just browsing. Here’s a simple structure that works:
Flag → Diagnose → Act (or defer)
When a metric moves more than 15–20% in either direction, flag it. Then ask: is this a one-week fluctuation or a trend? If it’s a trend, find the cause before the week ends. If it’s a one-week blip, note it and watch next Monday.
You don’t need to fix everything on Monday. You need to know what needs fixing.
A Note on Tools
These 12 metrics don’t need a paid analytics suite. GA4, your ad dashboards, a CRM, and an email tool get you most of the way there. The actual problem is consolidation — not data access.
Some founders build a Google Sheet that pulls everything together Sunday night, using Looker Studio or a Zapier connection. Others pay for Databox or Whatagraph. The tool choice genuinely doesn’t matter that much. What breaks the habit is not having one place to open on Monday morning and get through it in 20 minutes.
Frequently Asked Questions
Q1. What are the performance marketing metrics every founder must know?
A: Six numbers are enough to tell you whether your funnel is healthy week to week: CAC, ROAS, MQL volume, lead-to-customer conversion rate, CPC by campaign, and revenue by channel. Together they show you what you spent, who it brought in, and whether those people actually bought something. That’s the whole story.
Q2. What is the 3-3-3 rule for marketing?
A: The 3-3-3 rule splits your content into thirds. One third promotes your product. One third teaches something useful. One third just talks to people, questions, opinions, conversations that don’t ask for anything.
It’s not a law. Plenty of good content strategies ignore it entirely. But if you look at your last 30 posts and 25 of them are product announcements, that’s probably why your engagement is flat.
Q3. What are the 4 pillars of KPI?
The four pillars are usually described as: Specific (you’re measuring something concrete, not a vague concept), Measurable (you can track it the same way every time), Actionable (if the number moves, you do something about it), and Relevant (it connects to an actual business goal, not just something easy to count). Different frameworks label these differently, but the core idea holds — a KPI that isn’t tied to a decision isn’t really a KPI. It’s just a number you watch.
Q4. What are the 4 performance metrics most commonly used in digital marketing?
A:ROAS, CPC, CTR, and Conversion Rate are everywhere — Google Ads, Meta, email tools, basically any dashboard you open. They’re universal mostly because every platform reports them by default, not because they’re automatically the right metrics for your specific business. Worth tracking. Just don’t confuse “widely used” with “most important.”
You might also like


Let’s chat...
AS SEEN ON

awards

Excellence
in Digital Marketing
Women CPO
of the year 2023
Transformational
Leaders to Watch
Most Trusted
Companies


-

INDIA
NCR
+91-9811348433 Digital Impressions (INDIA)
29-36 LGF, Charmwood Plaza,
Delhi NCR - 121009
India
-

INDIA
GURUGRAM
+91-9811348433 Digital Impressions (INDIA)
4th Floor, JMD MEGAPOLIS, FF-402,
Badshahpur Sohna Rd, Sector 48,
Gurugram, Haryana 122018
India
-

USA
ATLANTA, GEORGIA
+1-7702501515 Digital Impressions (USA)
1445 Woodmont Ln NW,
4515 Atlanta Georgia - 30318
United States
-

UAE
DUBAI, UAE
+971-545502300 Digital Impressions (FZCO)
72819, IFZA Business Park, A1
Dubai Silicon Oasis - 342001
UAE


